
When DeepSeek announced it had trained a frontier-scale language model for about $6M on older Nvidia H800 GPUs, the number startled the market. The assumption was that the frontier of artificial intelligence would be dictated by hardware. New chips, new nodes, new power. But that figure suggested something else is happening. If software keeps improving at this pace, the bottleneck in AI might not be silicon at all.
To explore this idea further, I built a model comparing software efficiency gains against GPU hardware efficiency, and translated both into a cost model for training and inference. The goal was simple: to understand if and when software efficiency begins to outrun hardware improvement and how that changes the economics of AI.
1. Quantifying the two curves
Hardware: the steady march
Hardware improvement is visible and well documented. Across generation, from Hopper to Blackwell, Nvidia and independent benchmarks show roughly 1.5–2.0× throughput gains per generation. That annualizes to about 35–60% per year depending on cadence.
A broader study of over 470 GPUs released between 2006 and 2021 found that floating-point operations per second per dollar doubled roughly every 30 months, a little slower than Moore’s Law but consistent enough to anchor forecasts. That’s the hardware baseline I use here: a 30-month doubling in price-performance.
Software: the accelerating curve
The software side moves differently. A 2021 MIT study covering more than a thousand papers found that 43% of algorithm families improved as fast or faster than hardware, and 14% improved dramatically faster, sometimes by orders of magnitude. In machine learning, this trend has only intensified.
OpenAI’s 2020 analysis showed that the compute required to match AlexNet-level performance fell 44× in seven years, or a 16-month doubling in efficiency. In large language models, research from Epoch found the compute needed to reach the same benchmark halving roughly every eight months—a rate almost four times faster than hardware progress.
Table 1 shows the simple forecast of these two doubling patterns.
Table 1. Cumulative Efficiency Multipliers (Baseline = 2025)
| Year | Hardware (30-month doubling) | Software (8-month doubling) | Combined (Multiplicative) |
|---|---|---|---|
| 2025 | 1.0 | 1.0 | 1.0 |
| 2026 | 1.3 | 2.8 | 3.7 |
| 2027 | 1.8 | 11.3 | 20.3 |
| 2028 | 2.3 | 45.3 | 104.1 |
| 2029 | 3.0 | 181.0 | 543.0 |
| 2030 | 4.0 | 724.1 | 2,896.3 |
By 2030, hardware provides a respectable 4× improvement, but software’s theoretical gain approaches 724×. Combined, the potential efficiency gain exceeds 2,800×. The math looks extreme because software progress comes in steps. A single breakthrough—a new attention kernel, a quantization trick—can collapse years of hardware progress into one release.
2. Modeling adoption and reality
Theory and practice diverge. Algorithmic advances don’t spread instantly, and hardware efficiency includes vendor-driven software like cuDNN or TensorRT that blurs the line. To capture what happens in the real world, I modeled three scenarios from 2025 through 2030 with adoption events that reflect realistic rollout timing.
Table 2. Annualized Rates and Step Events
| Scenario | Hardware Growth | Software Growth | Adoption Events |
|---|---|---|---|
| Conservative | +25%/yr | +10%/yr | none |
| Base | +40%/yr | +30%/yr | 2026 ×1.5, 2027 ×1.2 |
| Aggressive | +35%/yr | +45%/yr | 2026 ×1.5, 2027 ×1.2 |
The step multipliers simulate widespread adoption of multi-token decoding (2026) and KV-cache compression (2027)—two current areas of rapid optimization.
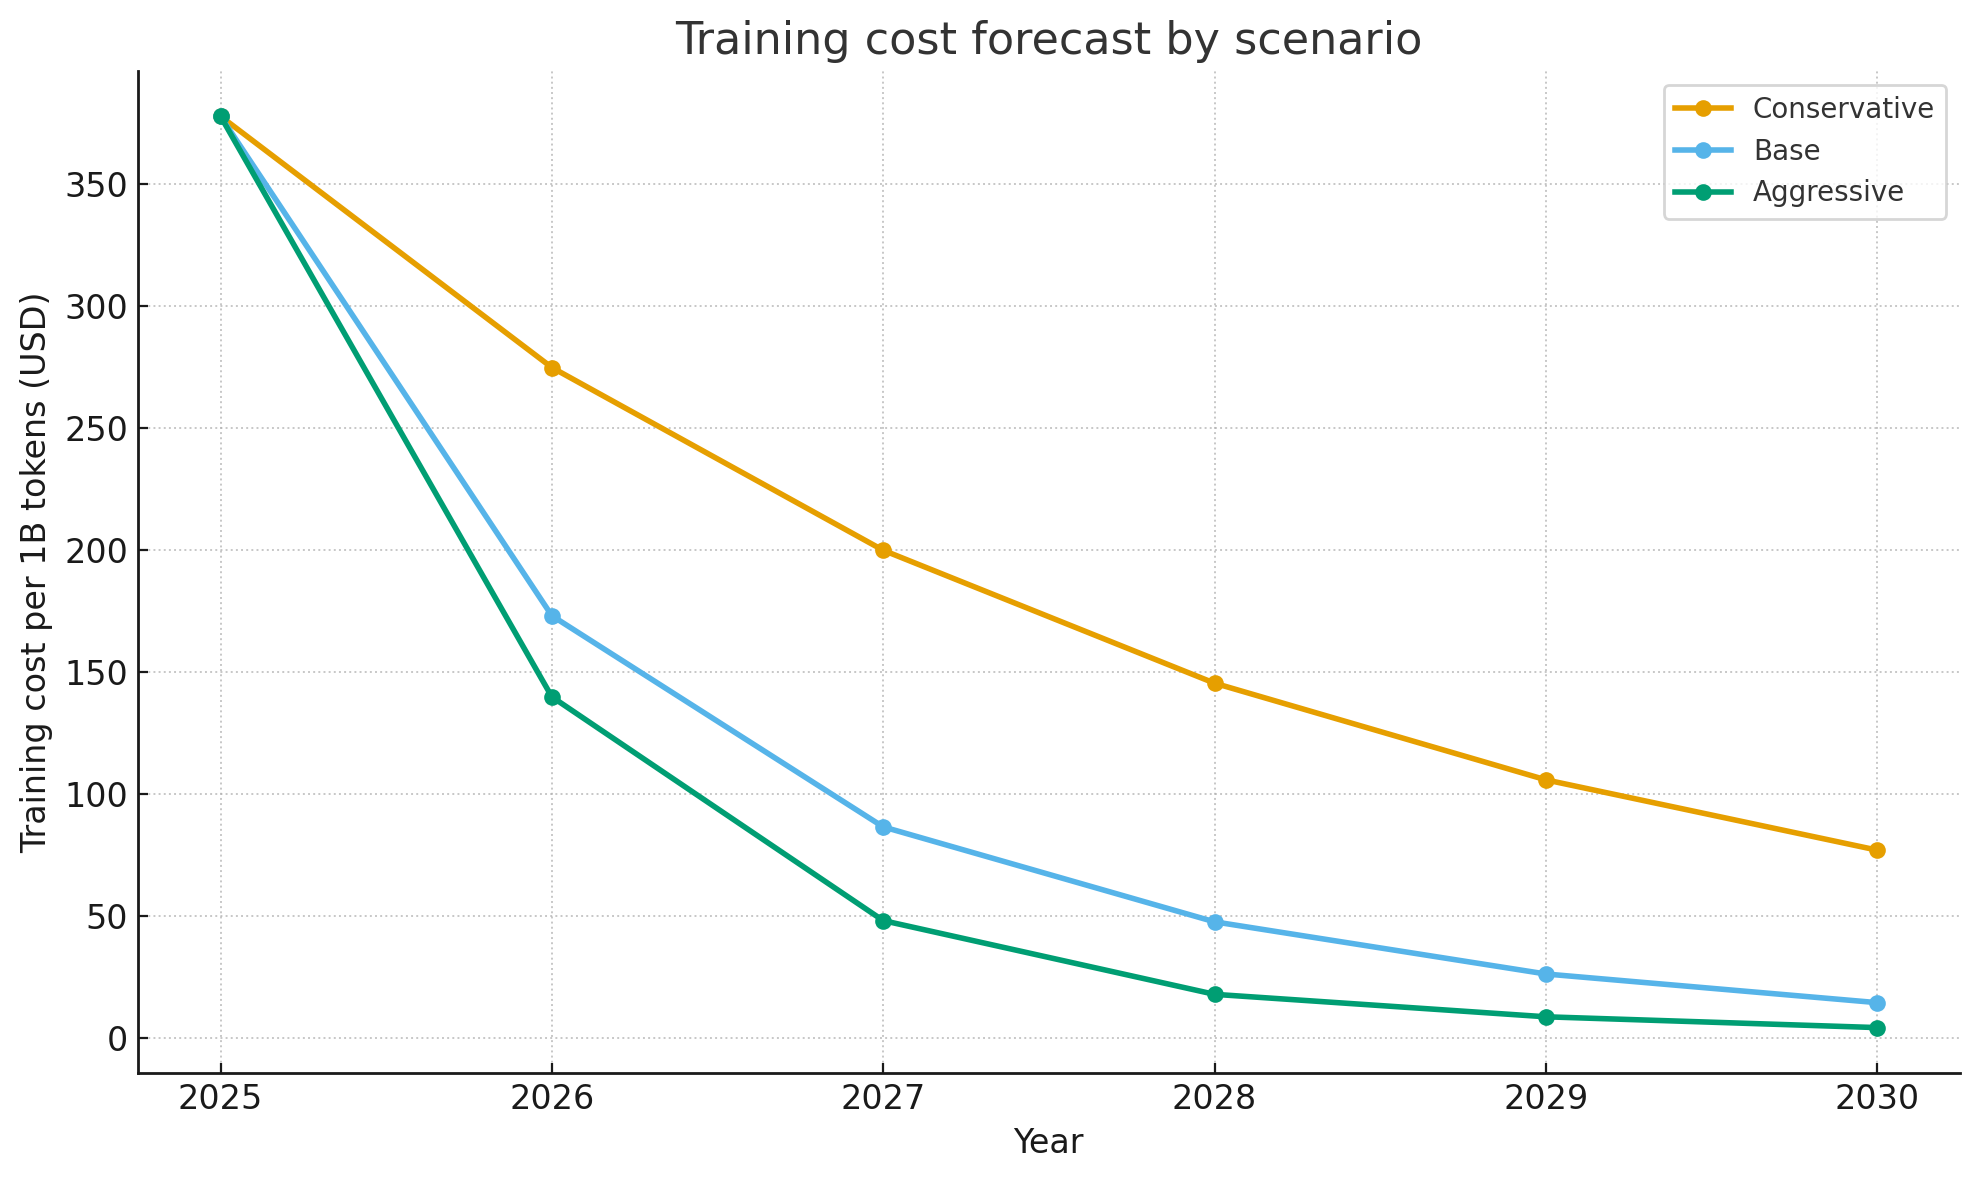
Table 3 shows the resulting efficiency multipliers and implied training cost per billion tokens, starting from DeepSeek-V3’s reported baseline of $378 per billion tokens.
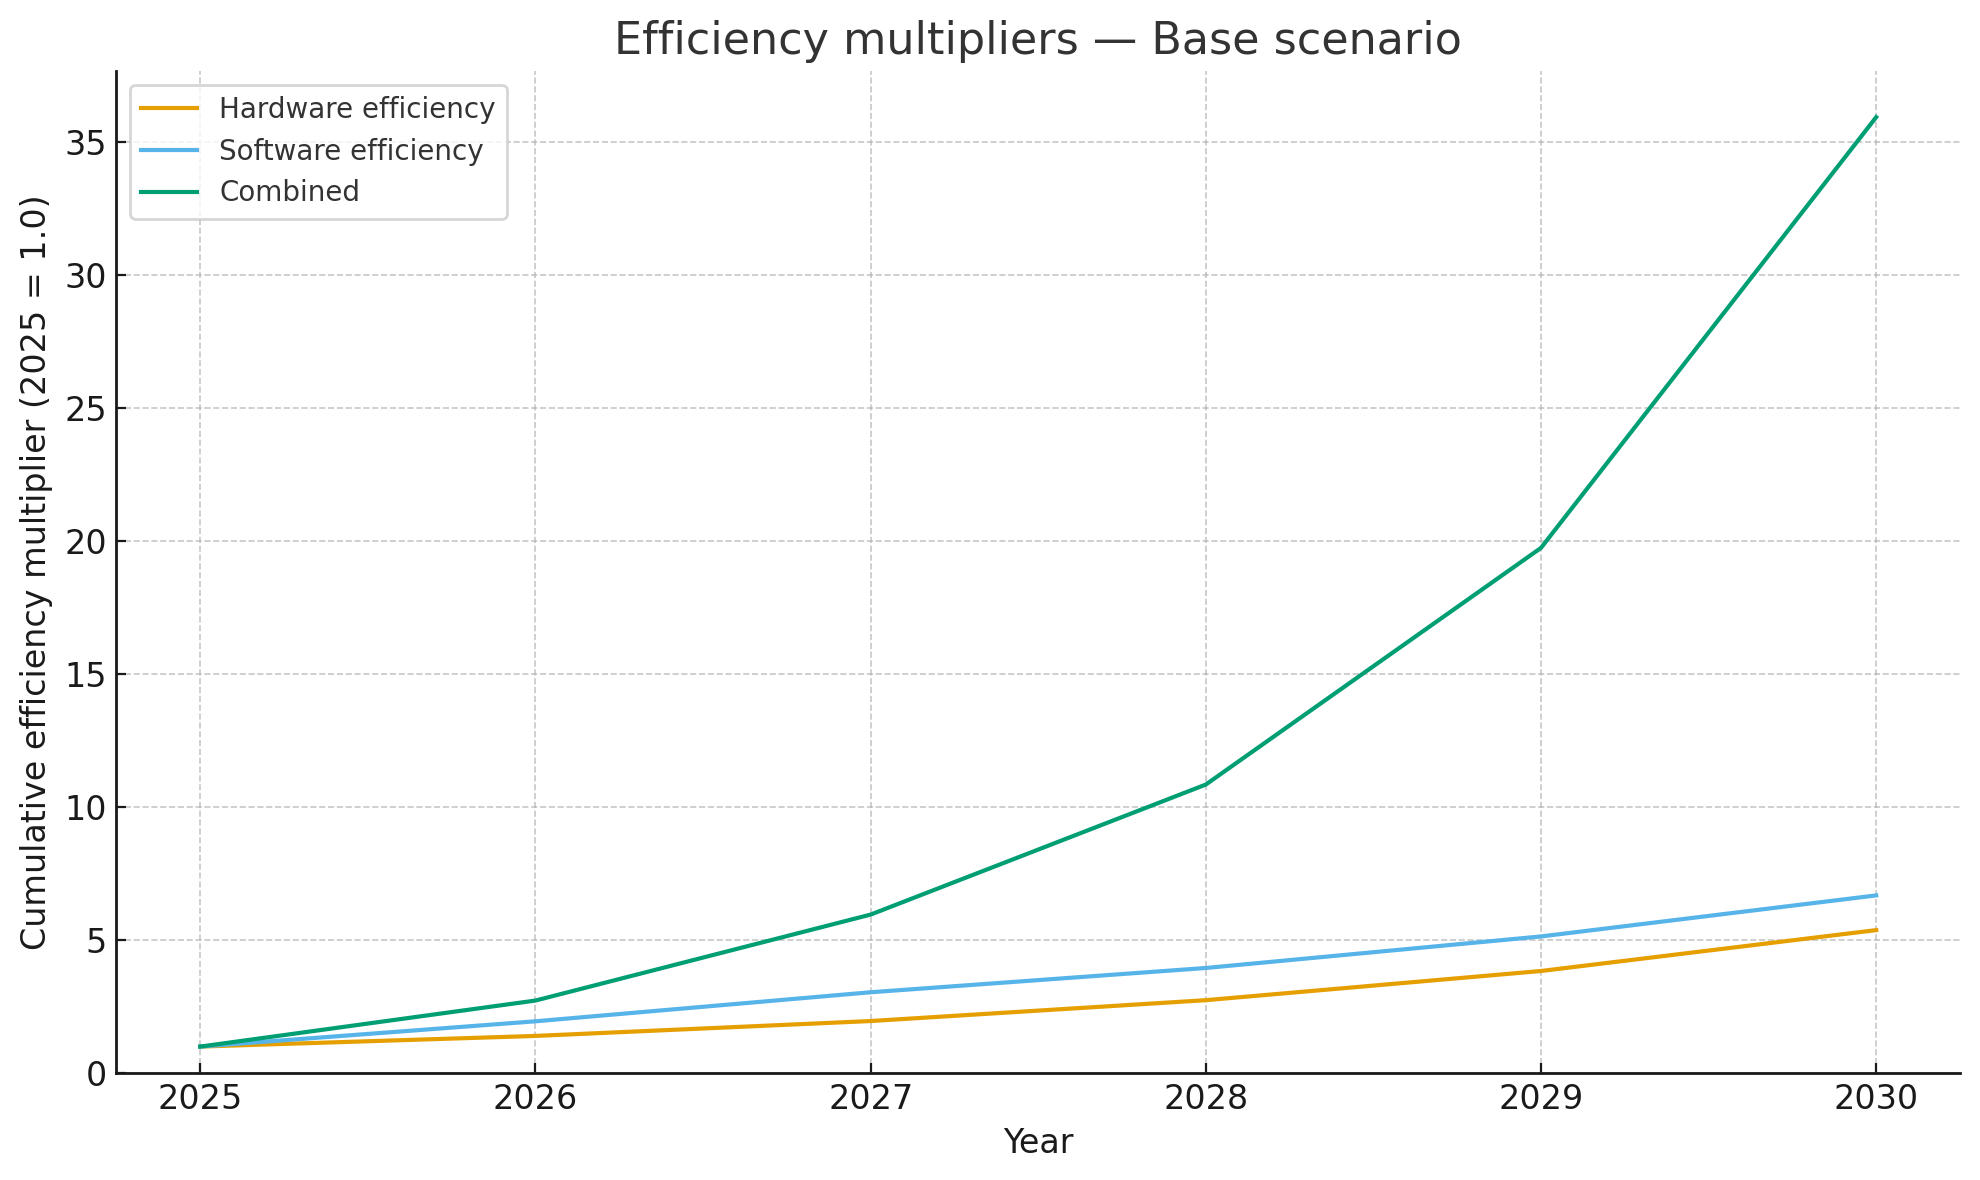
Table 3. Forecast – Base Scenario
| Year | Hardware Multiplier | Software Multiplier | Combined | Cost per B Tokens (USD) |
|---|---|---|---|---|
| 2025 | 1.0 | 1.0 | 1.0 | 378 |
| 2026 | 1.4 | 1.95 | 2.73 | 137 |
| 2027 | 1.96 | 3.51 | 6.88 | 55 |
| 2028 | 2.74 | 4.56 | 12.5 | 30 |
| 2029 | 3.84 | 5.93 | 22.8 | 17 |
| 2030 | 5.38 | 7.7 | 41.4 | 9 |
In this projection, software overtakes hardware in 2026, and by 2030 training cost per billion tokens falls from about $378 to under $10. Even the conservative path (hardware only) drops cost to roughly $78. The aggressive path brings it into the low teens by 2029.
3. Cost and leverage
The economic implications follow directly. Hardware efficiency gains reduce cost linearly, where each new GPU adds throughput in proportion to its performance per dollar. Software gains compound. A single algorithmic improvement immediately scales across every installed GPU and every workload that uses the same code path. That difference reshapes return on investment.
Table 4. Hardware vs. Software Investment Models
| Metric | Hardware-Centric | Software-Centric |
|---|---|---|
| Cost Type | Capital Expenditure | Research & Development |
| Recurrence | Recurring per expansion | One-time per innovation |
| Scalability | Linear with capacity | Exponential across fleet |
| ROI Horizon | Short, incremental | Long, compounding |
Hardware still demands enormous recurring capital. Global data-center CapEx exceeded $333 billion in 2023, rose by roughly 40% through 2024, and is on track to pass $600 billion this year. Most of that spending is bound up in power, cooling, and networking infrastructure which rise linearly with every new rack of GPUs.
Software R&D, by contrast, is front-loaded but durable. Once a more efficient training algorithm or inference kernel is developed, it propagates at near-zero marginal cost. A single 2× software improvement effectively doubles data-center capacity without buying a single new chip.
Some readers will argue Jevons’ paradox applies here. Make something cheaper and you get more of it. The history of computing shows a more conditional pattern. In capital-intensive platforms, efficiency gains often collapse unit cost and expand adoption while total infrastructure growth slows, shifts, or moves outward to new layers. The rebound is real, but it does not always appear as a straight line of hyperscale capex. It often shows up as diffusion.
4. Historical echoes
This dynamic has appeared before. Each cycle starts with brute force and ends with refinement, then the locus of scale changes. In the 1980s, compilers and operating systems squeezed more work from mainframes and minicomputers. In the 1990s, indexing and caching made databases faster without bigger arrays. In the 2000s, virtualization raised utilization from low double digits to above eighty percent, then shifted the center of gravity to the cloud.
Note what did and did not happen. Efficiency did not trigger infinite growth of the same box. It made the box more valuable, then pushed scale into a new layer. Virtualization did not shrink compute; it recomposed it into clouds. Database efficiency did not kill storage; it unlocked analytics and with it more data. The pattern suggests that AI efficiency will pull demand away from hyperscale training farms and redirect it toward new tiers of inference and edge compute.
5. Implications for industry structure
If the crossover holds, the unit economics of AI will invert. Hardware vendors like Nvidia still dominate the value chain, but their pricing power relies on the assumption that performance scales mainly with silicon. Once algorithmic efficiency compounds faster, the bottleneck shifts to ideas, not fabrication.
Cloud providers like AWS, Google, and Microsoft will find that every breakthrough in model efficiency devalues their fixed GPU fleets. Margins will migrate toward whoever controls the software stack that delivers more throughput per watt or per dollar. Efficiency lowers the price of their core product, yet it also creates demand for higher-level services that package the gains. If they move up the stack and sell performance and cost-per-token guarantees, they capture value. If they stay at raw instances, they get squeezed.
For startups, this transition is a gift. The capital barrier to training competitive models falls each year. A frontier-scale run that costs six million dollars in 2025 could cost hundreds of thousands by the end of the decade.
6. The efficiency spread
Both models—the exponential theoretical and the adoption-weighted forecast—lead to the same qualitative outcome. Hardware improvement remains important but secondary. The spread between the two curves, the “efficiency gap,” represents the unrealized potential created by algorithmic progress that has not yet been commercialized.
Managing that gap becomes the strategic question. Firms that can shorten the adoption lag between algorithmic discovery and production deployment will capture most of the economic value.
In practical terms, this means reorganizing research pipelines around efficiency rather than scale. The next competitive edge may come not from bigger clusters but from faster kernels, better caching, and smarter decoding strategies.
7. Outlook
The curves continue to diverge through the 2020s. Hardware efficiency may keep doubling every thirty months. Software efficiency, even if it slows from its current eight-month doubling, still compounds several times faster.
By 2030, training costs fall an order of magnitude or more. Inference will follow as quantization, caching, and multi-token decoding mature. These improvements are cumulative as each technique stacks on top of the last.
The pattern is familiar in computing history. Each era of brute-force expansion eventually yields to an era of refinement. We may be approaching that moment again.
The scarce resource in AI is no longer silicon. It’s ingenuity.
Methodology
The model combines empirical data on GPU hardware performance with published research on algorithmic efficiency and a real-world cost anchor from DeepSeek-V3.
- Hardware baseline
The hardware efficiency curve is based on Nvidia GPU progress over five generations: Pascal, Volta, Ampere, Hopper, and Blackwell. Benchmarks from Nvidia and independent MLPerf datasets show throughput improving about 1.5–2.0× per generation. Averaged across release cadence, this corresponds to a 30-month doubling in performance per dollar.
Hardware efficiency is modeled as:
H(t) = 2^(t / 2.5)
where t is time in years after 2025 and 2.5 years represents a 30-month doubling. - Software baseline
The software curve uses empirical results from MIT CSAIL (2021), OpenAI (2020), and Epoch (2024). MIT found that 43% of algorithm families improved as fast or faster than hardware, and 14% improved dramatically faster. OpenAI and Epoch both reported that the compute required to reach equivalent performance halved roughly every eight months.
Software efficiency is modeled as:
S(t) = 2^(t / 0.67)
where 0.67 years (eight months) is the doubling period. - Scenario adjustment
To account for real-world adoption rather than idealized potential, three scenarios were modeled:The 2026 event represents adoption of multi-token and speculative decoding (roughly +50% improvement). The 2027 event represents KV-cache compression and similar inference optimizations (+20%).- Conservative: hardware +25% per year, software +10% per year, no step events
- Base: hardware +40% per year, software +30% per year, with 1.5× multiplier in 2026 and 1.2× in 2027
- Aggressive: hardware +35% per year, software +45% per year, same step events as base
- Combined efficiency
Hardware and software gains are treated as independent and multiplicative.
T(t) = H(t) * S(t)
where T(t) is the combined efficiency multiplier relative to 2025. - Cost calibration
DeepSeek-V3’s published training cost provides the baseline. It trained 14.8 trillion tokens for roughly $5.6 million, or $378 per billion tokens in 2025.
Training cost in later years is computed as:
C(t) = C_2025 / T(t)
where C_2025 = 378 USD and T(t) is the combined multiplier for year t. - Sensitivity analysis
Adjusting the hardware growth rate by ±10% or delaying software adoption by a year shifts the crossover point by less than one year. Removing all software step events raises the projected 2030 cost to about $20–25 per billion tokens, still an order-of-magnitude drop from the 2025 baseline. - Limitations
Hardware and software improvements are assumed independent, although vendor software such as CUDA, cuDNN, and TensorRT partially couples them. The model also holds power pricing and utilization efficiency constant. These simplifications bias the output slightly toward optimism but do not affect the main conclusion: software efficiency growth already exceeds hardware efficiency growth between 2025 and 2026.